SilkPerformer reports percentiles in a different section than the main table and it can be time consuming, if you want to publish all the metrics in a single table. Therefore to solve this issue, a colleague (Murray Wardle) of mine wrote a visual basic script that generates a table with all the metrics.
He has kindly allowed me to share it here and below is his description on how to use it.
"Publishing results from SilkPerformer can sometimes be very time consuming. Most projects will have requirements involving the 90th or 95th percentiles and for some reason SilkPerformer reports percentiles in a different section of the report and not in the main table I wish to publish.
Generally in my scripts I’ll use Timers for measuring response times (I’m not too keen of the automatic page and form timers) for timers controlled with the MeasureStart() and MeasureStop() functions, Inserting the following into the TInit will enable percentiles to be calculated for the Timers.
MeasureCalculatePercentiles(NULL,MEASURE_TIMER_RESPONSETIME);
Unfortunately percentiles are displayed in a different section of the report to the Min, Avg, Max, StdDev, Count, and it’s a waste of time trying to copy and paste the values into a spreadsheet.
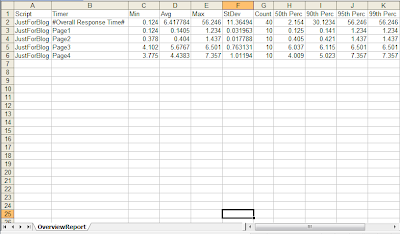
So, here is a simple little script which does the work. Just drag and drop the OverviewReport.xml file onto the script and it will create a csv file with the following:
ScriptName, TimerName, Min, Avg, Max, StDev, Count, 50th Perc, 90th Perc, 95th Perc, 99th Perc"
NOTE: You are allowed to use the code as long as you acknowledge the author.
'Copyright (c) 2012 Murray Wardle, murray.wardle@advancedperformance.com.au
'Permission is hereby granted, free of charge, to any person obtaining a copy of this software and associated documentation files (the "Software"), to deal in the Software without restriction, including without limitation the rights to use, copy, modify, merge, publish, distribute, sub license, and/or sell copies of the Software, and to permit persons to whom the Software is furnished to do so, subject to the following conditions:
'The above copyright notice and this permission notice shall be included in all copies or substantial portions of the Software.
'THE SOFTWARE IS PROVIDED "AS IS", WITHOUT WARRANTY OF ANY KIND, EXPRESS OR IMPLIED, INCLUDING BUT NOT LIMITED TO THE WARRANTIES OF MERCHANTABILITY, FITNESS FOR A PARTICULAR PURPOSE AND NON INFRINGEMENT. IN NO EVENT SHALL THE AUTHORS OR COPYRIGHT HOLDERS BE LIABLE FOR ANY CLAIM, DAMAGES OR OTHER LIABILITY, WHETHER IN AN ACTION OF CONTRACT, TORT OR OTHERWISE, ARISING FROM, OUT OF OR IN CONNECTION WITH THE SOFTWARE OR THE USE OR OTHER DEALINGS IN THE SOFTWARE.

Option Explicit

Dim xmlDoc
Dim scriptName, scriptNodes, SNode, TNode, timerNodes, timerName
Dim reportFile, outputFile
Dim myFSO, fileHandle
Dim min, avg, max, stDev, count, p50, p90, p95, p99
Set xmlDoc = CreateObject("Microsoft.XMLDOM")

Const ForReading = 1, ForWriting = 2, ForAppending = 8

If Wscript.Arguments.Count = 0 Then
    msgbox "Please specify the overview Report file to process"
Else

 ' Get report file name & set output filename
    reportFile = Wscript.Arguments(0)
 outputFile = Left(reportFile, Len(reportFile)-3) + "csv"

 xmlDoc.async = false
 xmlDoc.SetProperty "SelectionLanguage", "XPath"
 xmlDoc.SetProperty "ServerHTTPRequest", True
 xmlDoc.validateOnParse = False
 xmlDoc.resolveExternals = False

 'load overview report
 xmlDoc.load(reportFile)
 xmlDoc.setProperty "SelectionLanguage", "XPath"

 'open csv file to dump results into
 Set myFSO = CreateObject("Scripting.FileSystemObject")
 Set fileHandle = myFSO.OpenTextFile(outputFile, ForWriting, True)
 fileHandle.WriteLine("Script,Timer,Min,Avg,Max,StDev,Count,50th Perc,90th Perc,95th Perc,99th Perc")

 'For each script
 Set scriptNodes = xmlDoc.selectNodes("/Overview_Report_Data/UserGroups/Group")
 For Each SNode in scriptNodes
  scriptName = SNode.SelectSingleNode("Name").text

  'For each measure of type Timer
  Set timerNodes = SNode.selectNodes("Measures/Measure")
  For Each TNode in timerNodes
   If TNode.SelectSingleNode("Class").text = "Timer" then

    ' Extract the timer data
    timerName = TNode.SelectSingleNode("Name").text
    min = TNode.SelectSingleNode("MinMin").text
    avg = TNode.SelectSingleNode("Avg").text
    max = TNode.SelectSingleNode("MaxMax").text
    stDev = TNode.SelectSingleNode("Stdd").text
    count = TNode.SelectSingleNode("SumCount2").text
    p50 = TNode.SelectSingleNode("Percentiles/Values/Value[1]/Value").text
    p90 = TNode.SelectSingleNode("Percentiles/Values/Value[2]/Value").text
    p95 = TNode.SelectSingleNode("Percentiles/Values/Value[3]/Value").text
    p99 = TNode.SelectSingleNode("Percentiles/Values/Value[4]/Value").text

    'Write to File
    fileHandle.WriteLine(scriptName+","+timerName+","+min+","+avg+","+max+","+stDev+","+count+","+p50+","+p90+","+p95+","+p99)

   end if

  Next 'TNode in timerNodes

 Next 'SNode in scriptNodes

 fileHandle.Close

End If
Example:
1: Save the above code as a visual basic script into a folder. Lets call this script as "ExtractOverviewReportData.vbs".
2: Navigate to you SilkPerformer project and copy OverviewReport.xml into the folder where you have saved vbs script. See the screenshot below.
When you open the xml file, it would look something like this:
  1.100000000
  ABCDEFG
   ForMyBlog.tsd (D:\Silkperformer_Projects\ABCDEF\)
  Silk Performance Explorer
  Monday, 20 April 2012 - 3:00:00 AM
  1

    Header
    ABCD
    8
    None
    1
    28/05/2012 1:00:12 AM
    6280.000000000
    4
    Merged
    MPPO SVT
    23

  ...

          Timer
          #Overall Response Time#
          Response time[s]
          Seconds
          0.000000000
          0.000000000
          3
          2
          Response time[s]
          200.000000000
          100.000000000
          830.000000000
          35000.000000000
          0.500000000
          60.00000000
          6.412345678
          11.123456789

            0.000000000
            0


            0.000000000
            0

          0

            0


                50
                1.123456789


                90
                22.123456789


                95
                60.00000000


                99
                60.00000000


    ...
3:Now drag and drop the OverviewReport.xml file onto the script and it will create a csv file.
4: Now open up the csv file in excel and you should have all the necessary metric. You will see something like this:


