Just wanted to let the community know that I no longer user blogger to blog by articles.
As of this month, I have started blogging on my own website called OzPerf.
As of this month, I have started blogging on my own website called OzPerf.


| Cmd /V:on /c {mergecap wireshark utility} -w {mergefile name} {files to merge} |
| Cmd /V:on /c "c:\Program Files\Wireshark\mergecap.exe" -w allWireshark.pcap wiresharkDump*.pcap |


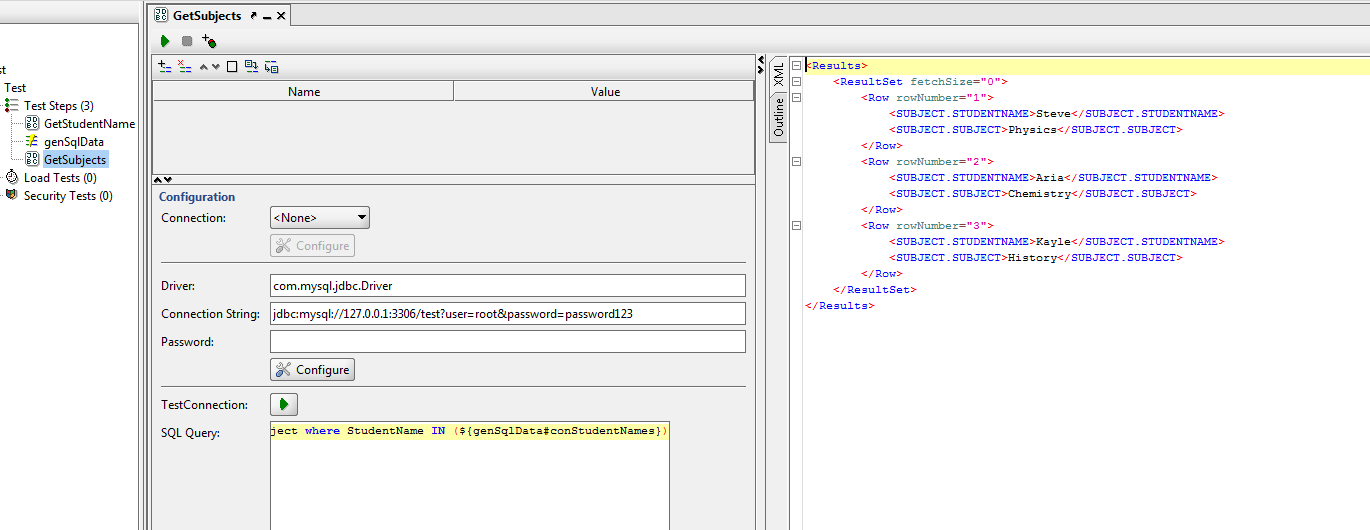
def groovyUtils = new com.eviware.soapui.support.GroovyUtils(context)
def holder = groovyUtils.getXmlHolder("GetStudentName#ResponseAsXml")

def concSqlString=""   //initialize parameter string concSqlString
def cnt =1             //initialize counter

//Get the total count of records that have the CLASS.STUDENTNAME
def xmlRecCount=holder["count(//Results[1]/ResultSet[1]/Row/CLASS.STUDENTNAME)"]


//check if only one row is returned
if (xmlRecCount.toInteger()==1)
{
      node = holder.getNodeValue('//Results[1]/ResultSet[1]/Row/CLASS.STUDENTNAME')
     concSqlString=concSqlString +"\""+node+"\""
}
else{
        //for each node, concatenate the node value to concSqlString variable
 for (node in holder['//Results[1]/ResultSet[1]/Row/CLASS.STUDENTNAME'])
 {
 if(cnt<xmlRecCount.toInteger()){
  concSqlString=concSqlString+"\""+node+"\","
  cnt=cnt+1
 }
 else
 concSqlString=concSqlString +"\""+node+"\""
 }
}

//return the concSqlString
return concSqlString
Action()
{

 //Capture all the Link IDs
 web_reg_save_param("LinkID","LB=id=\"","RB=\" href=\"default.aspx?content=business_","ORD=ALL",LAST);

 lr_start_transaction("VU01_01_Homepage");
 web_browser("website",
  DESCRIPTION,
  ACTION,
  "Navigate={WebsiteUrl}",
  LAST);

 lr_end_transaction("VU01_01_Homepage",LR_AUTO);

 lr_think_time(10);


 //Save a randomly selected ID to a Parameter
 lr_save_string(lr_paramarr_random("LinkID"),"RandomLink");

 //Printout the randomly selected parameter
 lr_output_message("%s",lr_eval_string("{RandomLink}"));

 //Navigate to the appropriate webpage associated to the ID
 lr_start_transaction("VU01_02_RandomLink");

 web_text_link("Links",
  "Snapshot=t2.inf",
  DESCRIPTION,
  "Id={RandomLink}",
  ACTION,
  "UserAction=Click",
  LAST);

 lr_end_transaction("VU01_02_RandomLink",LR_AUTO);

 web_browser("Sync",
  "Snapshot=t3.inf",
  DESCRIPTION,
  ACTION,
  "Sync",
  LAST);

 return 0;
}
Following is a screenshot of replay log, displaying the random id's selected for each iteration. It also displays the values captured using web_reg_save_param function.
